What is digital elevation model and how it's used in mapping
Discover what is digital elevation model (DEM), how it's created, and why it matters for accurate mapping and terrain analysis.

At its heart, a Digital Elevation Model (DEM) is a 3D digital map of the bare-earth’s surface. Forget trees, buildings, or anything else sitting on top of the ground.
Think of it like draping a massive digital blanket over a landscape to capture the exact shape of every hill, valley, and plain beneath. That raw height data is the secret ingredient behind countless real-world and virtual applications.
A Foundation for Understanding Our World
The concept is surprisingly simple but incredibly powerful. Imagine a giant grid laid over the terrain. Each tiny square in that grid holds just one number: the elevation at that specific spot. When you stitch millions of these cells together, a stunningly detailed picture of the Earth’s topography emerges.
This grid-based model is the fundamental way we process and visualize terrain. It’s a core component within the larger world of mapping tech, which you can read more about in our guide on what are geographic information systems.
DEMs are essential products in the geospatial and remote sensing industries, serving as the bedrock for modern analysis. Their creation has come a long way, evolving from painstaking ground surveys to sophisticated satellite missions that map the entire planet.
A monumental leap forward was the Shuttle Radar Topography Mission (SRTM) back in 2000. In just 11 days, the Space Shuttle Endeavour used special radar instruments to map over 80% of the Earth’s landmass, creating the first near-global, high-resolution elevation dataset. It was a game-changer.
DEM vs. DSM: A Crucial Distinction
One of the first things to get straight is the difference between a DEM and a Digital Surface Model (DSM). They sound almost identical, but they capture very different things. Getting this wrong can completely throw off a project.
A DEM gives you the bare-earth elevation. A DSM, on the other hand, captures the height of the very first thing a sensor sees—whether that’s a treetop, a skyscraper, or the ground itself.
DEM vs DSM Core Differences
To make it crystal clear, here’s a quick breakdown of what sets them apart.
| Feature | Digital Elevation Model (DEM) | Digital Surface Model (DSM) |
|---|---|---|
| What It Measures | The bare ground surface | The top of all surface features |
| Objects Included | None (only terrain) | Buildings, trees, power lines, etc. |
| Primary Use | Hydrology, geology, terrain analysis | Urban planning, aviation, forestry |
| Analogy | The shape of the landscape under a blanket | A snapshot of the world as seen from above |
Knowing which model to use is everything. If you’re figuring out where floodwaters will go, you absolutely need a DEM to see the true ground path. But if you’re planning a drone route or checking cell tower signals, you’ll need a DSM to account for obstacles like buildings and trees that get in the way.
This simple yet profound technology powers an incredible range of applications. From helping hydrologists predict floodplains and urban planners design cities to allowing game developers to create stunningly realistic virtual worlds, the DEM is an indispensable tool. It provides the essential context of "where" and "how high," unlocking a deeper understanding of our planet’s surface.
How Digital Elevation Models Are Created
Forget the old image of surveyors with tripods and measuring poles. Creating a modern Digital Elevation Model is all about high-tech scanning from the sky and even from space, capturing the Earth’s bumps and dips with incredible precision.
The basic idea is pretty simple: measure the distance from a sensor on a plane or satellite down to the ground. Do that millions—or even billions—of times, and you can piece together a stunningly detailed 3D picture of the landscape below.
LiDAR: The Gold Standard for Accuracy
When accuracy is everything, LiDAR (Light Detection and Ranging) is the go-to technology. Picture an aircraft flying over an area, firing down billions of laser pulses in a rapid-fire sequence.
A LiDAR system works by timing how long it takes for each laser pulse to hit the ground and bounce back. Since we know the speed of light, that simple time measurement translates into a hyper-accurate distance, giving us a precise elevation point on the ground.
LiDAR is so sensitive it can often see through the trees. Some laser pulses reflect off the top of the forest canopy, but others sneak through the gaps to hit the bare earth. This allows us to create both a Digital Surface Model (DSM) of the treetops and a true Digital Elevation Model (DEM) of the ground underneath.
This incredible level of detail makes LiDAR essential for high-stakes work like mapping floodplains or planning major infrastructure, where every centimeter matters. The USGS's 3D Elevation Program (3DEP), for instance, leans heavily on LiDAR to build its high-resolution map of the entire United States.
Satellite and Aerial Methods
While LiDAR is unmatched for detail, other methods are better suited for mapping huge, continent-spanning areas.
Satellite Radar Interferometry (InSAR): This clever technique uses radar signals from satellites. A satellite pings the Earth's surface with a radar wave and listens for the echo. By comparing the signals from two slightly different orbital positions, scientists can calculate the topography based on tiny differences in the radar wave. The legendary Shuttle Radar Topography Mission (SRTM) used this exact method to map most of our planet.
Photogrammetry and Structure from Motion (SfM): This is a classic method with a modern twist. It starts with a series of overlapping aerial photos. Smart software then identifies common points in the images and, by analyzing how those points shift from one photo to the next, it reconstructs the 3D geometry of the terrain. To see how this is applied today, check out these modern methods of surveying with drones for precision data capture, which feed directly into creating detailed elevation models.
This technology is so powerful it can even breathe new life into old photos. In one amazing project, researchers in Ethiopia's Bale Mountains used 298 aerial photographs from 1967 and 1984 to generate DEMs with resolutions of 0.84m and 0.98m over a 5,730 km² area. You can read about how they turned historical images into new data in this Copernicus study.
Each of these methods provides the raw data that, once processed, becomes the DEMs that power everything from scientific breakthroughs to interactive tools like the ones we build at EarthChasers.
Decoding the Data: Raster vs. TIN Models
Once we capture elevation data from the sky, it's just a massive cloud of points. To make it useful, we need to organize it into a structure a computer can understand. This is where two primary models come into play: raster and TIN. While they both represent a 3D surface, they go about it in fundamentally different ways, and each has its own strengths.
The Grid Approach: Raster Models
The most common structure you'll encounter is the raster model. The easiest way to think of a raster DEM is as a digital photograph, but instead of color, each pixel holds a single number: its elevation. It's a simple, powerful grid laid over the landscape.
This grid-based approach is incredibly efficient for computers. It's fantastic at representing continuous, flowing surfaces like rolling hills or gentle plains where the elevation changes gradually. Because the structure is so consistent, running calculations like slope or aspect is straightforward and fast.
The infographic below shows the high-level methods used to gather the raw data that feeds into these models.
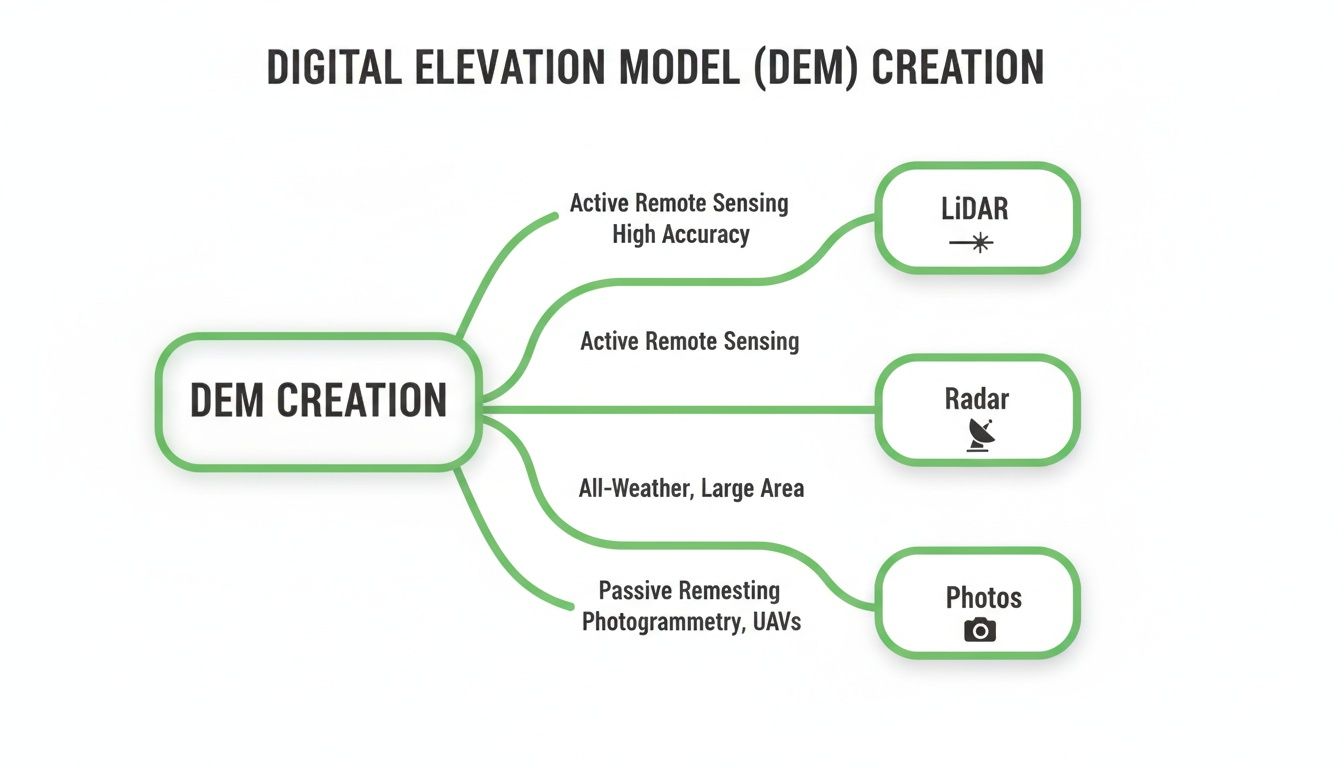
Whether it's from LiDAR, Radar, or Photos, this is the raw material that gets organized into either a raster grid or a TIN network.
The Smarter Structure of TIN Models
In contrast to the simple grid of a raster, you have the Triangulated Irregular Network, or TIN. A TIN isn't a uniform grid at all. It's a vector-based model built from a series of points with known X, Y, and Z (elevation) coordinates.
These points are connected to form a web of non-overlapping triangles. Here's the clever part: the triangles can be different sizes.
A TIN is an adaptive model. It uses many small, dense triangles to capture the intricate detail in rugged terrain like a mountain peak or a sharp riverbank. But for vast, flat areas like a plateau, it uses just a few large triangles because you don't need much detail there.
This adaptability makes TINs far more storage-efficient than rasters for landscapes with mixed topography. They don't waste disk space storing thousands of identical elevation points on a featureless plain. Plus, TINs are great at precisely defining specific landforms, since the edges of the triangles can be aligned perfectly with features like ridges, valleys, and streams.
Choosing the Right Model for the Job
So, which one is better? It’s not about which is "best," but which is right for the task at hand. Each model is a specialized tool.
Raster Models are your go-to for:
- Continuous Surface Analysis: Perfect for anything that analyzes the entire landscape, like calculating slope, aspect (the direction a slope faces), or creating a hillshade map for visualization.
- Hydrological Modeling: That grid structure is brilliant for simulating how water flows across terrain, finding drainage patterns, and mapping out watersheds.
- Image and Data Overlays: Their pixel format makes it a breeze to layer them with satellite imagery or other gridded data.
TIN Models are superior when you need:
- High-Precision Engineering: Often used for site design and calculating cut-and-fill volumes where you need to preserve specific terrain features with high accuracy.
- Efficient Data Storage: The best choice for datasets covering areas with a mix of flat and complex terrain, as they cut down on file size without losing important details.
- 3D Visualization: The triangular faces create clean, defined surfaces that look fantastic when rendering realistic 3D perspectives and fly-throughs.
Ultimately, knowing the difference between raster and TIN is key to working effectively with any DEM. While rasters are the workhorse for most broad-scale analysis, TINs offer a more refined and efficient way to handle complex topography for specialized jobs.
What Makes a Good DEM? Resolution and Accuracy
Just like a digital photo, not all Digital Elevation Models are created equal. You can have two models of the same mountain that look wildly different, and it all boils down to two key ideas: resolution and accuracy.
Getting a handle on these concepts is the first step to picking the right data for your project and avoiding some seriously flawed results.
DEM Resolution: How Much Detail Can You See?
Think of resolution as the pixel size of your elevation map. It tells you the size of each grid cell on the ground. For instance, a 90-meter DEM gives you one elevation value for every 90x90 meter square—an area bigger than a football field. It's great for seeing the big picture, like an entire mountain range, but it will completely gloss over smaller features like roads, buildings, or small streams.
Now, contrast that with a 1-meter DEM. Here, you get a new elevation value every single meter. This high resolution captures the terrain in stunning detail, revealing subtle dips and rises that are totally invisible in lower-resolution data. For any work that demands precision, like engineering plans or detailed flood mapping, high resolution isn't just nice to have—it's a must.
DEM Accuracy: Is the Data Correct?
While resolution tells you how much detail the map can show, accuracy tells you how well those elevation values match up with reality. A model can be incredibly high-resolution but still be flat-out wrong.
There are two main types of accuracy to think about:
- Horizontal Accuracy: This measures if a point in the model is in the right X/Y spot on the Earth. Bad horizontal accuracy means the entire map could be shifted a bit to the side.
- Vertical Accuracy: This is the one most people care about. It measures how close the DEM’s elevation value is to the true elevation on the ground. A DEM with a vertical accuracy of +/- 50cm is far more trustworthy than one that could be off by several meters.
Always dig into a dataset's metadata to find its official accuracy stats. High-end commercial DEMs from LiDAR can nail vertical accuracy down to less than 50cm. In contrast, free global datasets like SRTM are typically accurate to within about 10 meters.
The Vertical Datum: Your Starting Point for "Sea Level"
Finally, every DEM needs a consistent starting point for all its height measurements. This baseline is called a vertical datum. You can think of it as the official "zero" on the world's giant measuring stick for elevation.
Without a shared datum, comparing elevations between different maps would be a mess. A mountain peak might be 100 meters high on one map but 102 meters on another, just because they started counting from different zero points.
A vertical datum establishes a consistent surface from which all elevation values are measured. In North America, a common datum is the North American Vertical Datum of 1988 (NAVD88), which is based on a standardized calculation of mean sea level.
When you use a DEM, you're trusting that every single elevation point was measured from the same vertical datum. This is what provides the fundamental consistency that makes a DEM a reliable tool for understanding the shape of our world.
Finding and Using Free DEM Data
Embedded content
Alright, you get what a Digital Elevation Model is. Now for the fun part—getting your hands on the data and putting it to work. The best news? A huge amount of high-quality elevation data is completely free, all thanks to government agencies and scientific organizations around the globe.
You just have to know where to look. These public data portals open the door to datasets covering nearly the entire planet, letting you explore the topography of almost any place you can imagine.
Top Sources for Free Global DEM Data
While you can find countless regional datasets, a few major international hubs are the go-to starting points for anyone hunting for free elevation data. Think of them as massive digital libraries for the Earth's terrain.
These platforms are incredibly powerful, but they can feel a little intimidating at first. The trick is to go in with a clear idea of where you're looking and what kind of data you need.
- USGS EarthExplorer: This is the big one. Maintained by the U.S. Geological Survey, EarthExplorer is an unbelievably comprehensive catalog. It’s where you’ll find the famous Shuttle Radar Topography Mission (SRTM) dataset, which gives you near-global coverage at a solid 30-meter resolution.
- NASA Earthdata Search: As the central hub for NASA's treasure trove of Earth science data, this portal is another goldmine. It hosts a ton of different datasets, including DEMs from various satellite missions perfect for both scientific research and casual exploration.
- Copernicus Open Access Hub: This is your gateway to data from Europe's ambitious Copernicus program. Here you can grab global DEMs like the Copernicus DEM (GLO-30), which also offers a fantastic 30-meter resolution model of the world’s land surfaces.
Below is a quick reference for some of the most popular global datasets you'll come across.
Popular Global DEM Datasets at a Glance
This table sums up a few key global DEMs, their typical resolution, and where you can find them. It's a great starting point for figuring out which dataset best fits your needs.
| Dataset Name | Typical Resolution | Coverage | Primary Source |
|---|---|---|---|
| SRTM (Shuttle Radar Topography Mission) | 30 meters (1 arc-second) | Near-Global (60°N to 56°S) | USGS EarthExplorer |
| ASTER GDEM (Advanced Spaceborne Thermal Emission and Reflection Radiometer Global DEM) | 30 meters | Global | NASA Earthdata Search |
| Copernicus DEM (GLO-30) | 30 meters | Global | Copernicus Open Access Hub |
| ALOS World 3D - 30m (AW3D30) | 30 meters | Global | JAXA (Japan Aerospace Exploration Agency) |
These datasets have been foundational for countless projects, from academic research to the 3D terrain you see in video games.
The USGS EarthExplorer uses a simple map-based interface, as you can see above. You just draw a box around your area of interest, filter for the data you want (like a DEM), and see what's available.
Getting Started with DEM Software and Formats
Once you download a DEM, you need the right tools to actually open it and see what's inside. The data usually comes in special file formats built to handle geographic information.
The most common format you'll run into is the GeoTIFF (.tif). It might look like a regular image file, but it’s packed with crucial metadata—like the coordinate system and elevation units—baked right into the file itself.
For beginners and pros alike, QGIS is the best place to start. It’s a powerful, free, and open-source Geographic Information System (GIS) that can handle just about anything you throw at it. For those in a professional setting, commercial software like Esri's ArcGIS Pro offers an even bigger suite of advanced tools.
With a program like QGIS, you can start doing some real analysis right away. Here are a couple of simple but incredibly powerful things you can do with any DEM file:
- Create a Hillshade: This is one of the coolest and most intuitive things to do first. A hillshade simulates light and shadow across the terrain, creating a stunning 3D-like relief map that makes every hill and valley pop right off the screen.
- Calculate Slope: You can instantly generate a new map that color-codes the steepness of the terrain. This is super useful for everything from planning a hiking route to figuring out landslide risks.
These simple steps turn a boring grid of numbers into a rich, visual map. Of course, if you just want to find the elevation of a few specific points without downloading any data, our own free Elevation Finder tool gives you that info instantly for any location. It's a great first step before diving into full-blown GIS software.
Real-World Applications of Elevation Data
So, what can you actually do with a Digital Elevation Model? It’s far more than a fancy grid of numbers; it’s a foundational layer that brings the world’s surface to life. Once you have that data, you unlock a staggering range of applications across science, engineering, and even entertainment.
DEMs are the secret ingredient that turns a flat, boring map into a dynamic canvas for analysis. From predicting where a flood might strike to building breathtaking virtual worlds, the uses are as varied as the landscapes themselves.
Planning and Engineering Our World
When it comes to water, DEMs are indispensable. By looking at a "bare-earth" model, hydrologists can simulate exactly how water will flow across the land. This lets them map out entire watersheds, pinpoint areas vulnerable to flooding, and design smarter drainage systems. The data literally shows them where water will collect and which way it will run downhill.
Urban planners and civil engineers depend on this data every single day. Need to plan a new road, pipeline, or railway? A DEM gives you the elevation profiles required to calculate grades and map out the most efficient route. For communications, engineers run line-of-sight analysis between cell towers to ensure a clear signal path.
By understanding the precise shape of the terrain, planners can make smarter, safer, and more cost-effective decisions. A DEM can reveal a potential landslide risk on a steep slope or identify the perfect location for a wind turbine on an exposed ridge.
This kind of analysis is really just a modern evolution of old-school map-reading skills. If you want to dive into the fundamentals, check out our guide on how to read topographic maps, which breaks down the core principles of seeing elevation on paper.
Creating Breathtaking Virtual Environments
The impact of DEMs stretches far beyond science and engineering. This data is a cornerstone of the entertainment and simulation industries, providing the raw material for creating realistic 3D worlds we can explore and interact with.
Video game developers use DEMs to build vast, believable landscapes. Instead of spending countless hours sculpting every mountain and valley by hand, they can pull in real-world elevation data to create a game world that feels authentic. This technique is used for everything from the rolling hills of a fantasy kingdom to the rugged terrain of a modern warzone.
Flight simulators are another perfect example. To train effectively, a pilot needs to see an accurate representation of the ground below. High-resolution DEMs are critical for rendering the terrain they'll be navigating and landing on.
- Gaming: Developers use DEMs to generate realistic terrain, saving thousands of hours of manual design and creating far more immersive experiences for players.
- Flight Simulation: Accurate elevation data is crucial for building training environments where pilots can practice flying over true-to-life topography.
- 3D Art and Visualization: Artists use DEMs as a base for creating stunning relief maps and 3D scenes for films, documentaries, and educational content.
What starts as a scientific tool for measuring the Earth becomes an artistic canvas. It’s a perfect example of how versatile this data truly is, allowing us to see, understand, and appreciate our planet’s geography in completely new ways.
Common Questions About Digital Elevation Models
As you get your hands dirty with elevation data, a few questions always seem to surface. Let's clear up some of the most common points of confusion you'll run into when working with any digital elevation model.
What’s the Difference Between a DEM, DTM, and DSM?
These three acronyms are a classic source of mix-ups, but the difference is actually pretty simple once you visualize it. Think of them as different "layers" of the landscape.
- A Digital Elevation Model (DEM) is the catch-all term. It usually means the bare-earth surface—the ground itself, with all the buildings, trees, and cars scraped away.
- A Digital Terrain Model (DTM) is often used interchangeably with a DEM. Sometimes, though, a DTM is a bit smarter, including important landscape features like ridge lines to define the terrain's shape more accurately.
- A Digital Surface Model (DSM) is a top-down view of everything. It captures the elevation of whatever is on the surface, including the tops of buildings, the forest canopy, and any other structures.
To put it simply: a DEM or DTM gives you the ground, which is perfect for figuring out where water will flow. A DSM gives you the rooftops and treetops, which is what you need for line-of-sight analysis or planning a drone flight.
Which DEM Resolution Do I Need?
The right resolution completely depends on what you're trying to do. There's no single "best" option; it's all about matching the data's detail to the scale of your question.
If you're doing a broad, regional analysis—like mapping a massive watershed or looking at an entire mountain range—a lower-resolution 30-meter or 90-meter DEM is usually more than enough. Plus, it's a lot easier to process.
But for tasks that demand precision, you need to zoom way in. Detailed urban planning, flood modeling for a single neighborhood, or engineering a new construction site absolutely requires a high-resolution 1-meter or 5-meter DEM, which almost always comes from LiDAR data.
Are Digital Elevation Models Always Accurate?
Not at all. It's a huge mistake to assume all elevation data is equally reliable. The accuracy can vary wildly from one dataset to the next.
A DEM's quality depends on how the data was collected in the first place (LiDAR, for instance, is typically far more accurate than satellite radar). Accuracy can also take a nosedive in tricky terrain, like super steep slopes or areas covered in dense forest. Before you trust any DEM for a critical project, always check its metadata to understand its stated vertical and horizontal accuracy.
Can I Make My Own DEM?
Yes, and it's easier now than ever before. With a standard drone, you can fly over a small area and capture a series of overlapping aerial photos.
That imagery can then be fed into Structure from Motion (SfM) software. This cool technique analyzes the photos from different angles to reconstruct a 3D point cloud of the terrain, which you can then turn into your very own high-resolution DEM. This approach is a game-changer for super local projects in farming, construction, and environmental monitoring.
At EarthChasers, we make exploring the world's terrain easy and engaging. Our free tools like the Elevation Finder and Line of Sight calculator are built on these powerful DEM concepts, giving you instant access to elevation data without any complex software. Discover the world in 3D and test your geography skills at https://earthchasers.com.